NVSS Quarterly Provisional Estimates
The following designs were developed for the initial release of the NVSS Rapid Release of Quarterly Provisional Estimates. This reports series from the National Centers for Health Statistics includes select indicators of mortality, natality and infant mortality.
Mortality Dashboard | GitHub Repo
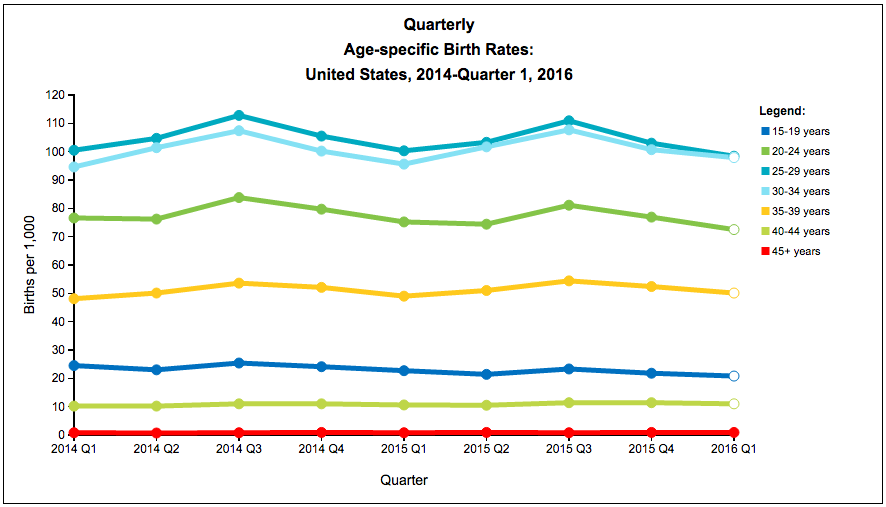
Natality Dashboard D3 Version | GitHub Repo
Natality Dashboard - Tableau Version | GitHub Repo
The designs were developed with the D3 JavaScript library and had the following requirements:
- Read data locally from CSV file on the web server
- Responsive behavior within BootStrap 2 framework
- Ability to save the SVG canvas as a PNG image
- Ensure accessibilty (i.e. 508 compliance) of the final design
- With Natality and Infant Mortality, allow users to select which indicators to include on the chart.
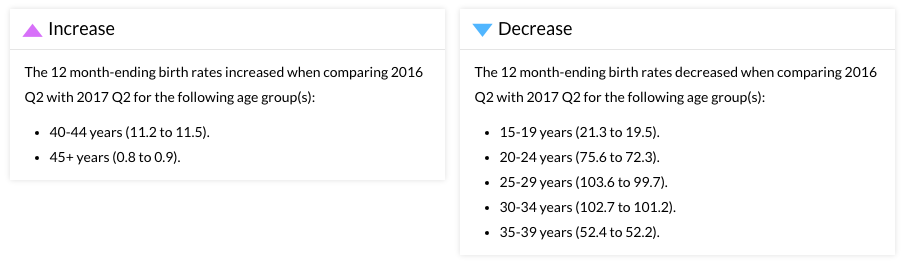
Since the initial release, the designs were updated to incorporate dynamic infographics presenting key trends. This replaced static text provided by the authors with scripted text updated with values dynamically from the dataset.
Future updates to the designs may include access of dataset from Socrata API endpoint rather than CSV and modification of the design for BootStrap 4 framework.